
Neutrophil Size Observations
StudyLTCOVID.com
Thanks for visiting!
To translate this page, select your
language from the dropdown menu below:
The results presented here are paired to a presentation in June of 2024.
The topic: Observations and Comparisons related to neutrophil size measurements,
carried out previously on 1 796 neutrophils from several subjects.
Variables that impacted on neutrophil size were given in that presentation, but include
For introductory and explanatory information, it is best to watch the actual presentation.
Information duplicated here allowed a more succinct presentation, while nevertheless providing access to observed results.
Here, the results of study, and as given in that presentation, will be repeated and summarized.
When comparisons have been made, observed differences are statistically significant unless stated otherwise. But the statistical values obtained from analysis of such comparisons of potential differences, will usually appear here as well.
It is important to emphasize that the samples are obtained by finger stick. That avoids problems with anticoagulants like EDTA as typically found in CBC tubes.
But what is the compartment of the body that is being sampled ?
It is the vascular space. Adding to our message here, it is the intravascular space. So when numbers change and cellular areas decrease for example, consider the possibility that the larger cells have moved into a different space: a different extravascular compartment of the body. There, outside of the capillary, one finds the metabolic or immune "calls" that the neutrophils are responding to. So they leave the capillary (where they exist in one shape usually spherical), to adapt shape (ovoid & ellipsoid), to required response activities. This change in shape or morphology, permits movement in response to biomolecular calls to action.
In what follows, some results will seem close to giving the same message, but the goal here is sharing complete results of the study so far, and as promised in the presentation first referred to.
Before beginning ...
"Getting a little excited about neutrophils: is that a normal sort of thing?
They're in there somewhere. Theyre doing what they're supposed to be doing ...
But measuring them one by one.
Where does that interest come from?"
This may help answer that question:
"During moderate- and vigorous-intensity aerobic exercise
bouts of less than 60 min duration, the antipathogen activity of
tissue macrophages occurs in parallel with an enhanced recirculation
of immunoglobulins, anti-inflammatory cytokines, neutrophils, NK cells,
cytotoxic T cells, and immature B cells, all of which play critical roles in
immune defense activity and metabolic health."
"In general, acute exercise is now viewed as an important
immune system adjuvant to stimulate the ongoing exchange of
leukocytes between the circulation and tissues."
The above is selected from:
The compelling link between physical activity and the body's defense system
And if still not at all excited by any of this, maybe you just need to close this down and play a video game or something.
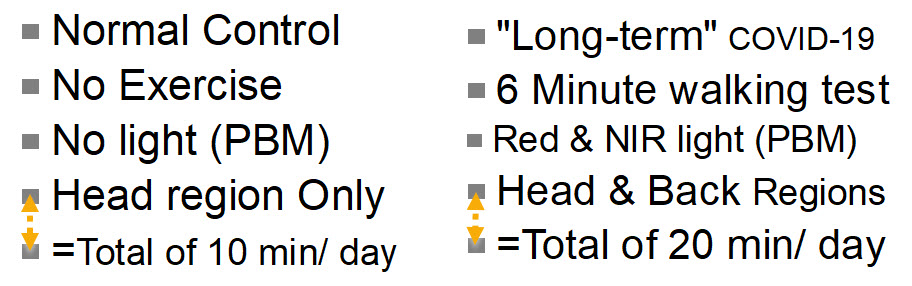
In Normal Controls (no COVID-19 ever, by History & Tests)
- Neutrophil size (area from two measurements) was about 150 to 160 µm²
- This is different than the commonly found "13.5 µm" diameter figure, found in the literature:
- Area = Pi x r², using a single maximal diameter measured with a light microscope, this well known equation overestimates size of ovoid and ellipsoid neutrophils by 15 to 20%.
- Our area results are from 2 perpendicular measurements of each cell.
- This is different than the commonly found "13.5 µm" diameter figure, found in the literature:
- In a negative control, (no COVID), before exercise, circulating neutrophils are 31% larger than those observed after exercise. Diff. in area: 47.11 µm² (no PBM involved here). Student's t-test, two-tailed: t = 7,7604; df = 58; p = 0,0001.
- In another negative control, (no COVID), before exercise, circulating neutrophils are 23% larger than those observed after exercise. Diff. in area: 35.8 µm² (no PBM involved here). Student's t-test, two-tailed: t = 4,4351; df = 58; p = 0,0001.
- Same negative control individual (No COVID) AFTER 10d PBM, brief moderate exercise (6'Walking Test) after 10 days of PBM to head region is associated with a significant reduction (-15.3%) in circulating neutrophil cell size. Difference in Mean size: 24,5 µm². Student's t-test, two-tailed: t = 4,4351; df = 58; p = 0,0001. (Same finding as before PBM, smaller cells after exercise).
- Same negative control individual (No COVID) BEFORE & AFTER 10d PBM, brief moderate exercise (6'Walking Test) on each Day 0 and Day 11. There is no significant change in neutrophil size (difference in Means: 2,66 µm², a diff. of 1.97%). Student's t-test, two-tailed: t = 0,4871; df = 58; p = 0,628 (N.S.) So exercise was again associated with reduced neutrophil size, but doing 10 days of PBM to Head Only, did not seem to impact this effect of exercise.
- In 2 Negative Controls (No COVID) AFTER 10d PBM, before exercise, circulating neutrophils are again 23% larger than those observed after exercise. (Suggesting: No additional PBM effect on cell size, to further modify the exercise effect in "normals"). Diff. in area: 35.9 µm². Student's t-test, two-tailed: t = 7,2998; df = 118; p = 0,0001
In a subject with Acute COVID-19, compared with her pre-infection, Pre-COVID-19 neutrophil cell size
- Below, a "highlights" video (shorter and faster) from 15-10-22 peripheral smear
- This is before any known viral contact or infection, or positive test, asymptomatic
- Below, a "highlights" video from 29-05-24
- This is after an infection on 17-01-24 which generated in the days that followed, mild symptoms and positive antigen tests for SARS-CoV-2
- Note that some of the cells captured here are not neutrophils but lymphocytes and others, included for size comparisons.
The above videos may give you a sense of how such measurements proceed.
But to say that the post-SARS-CoV-2 infection period is associated with any changes at all in this subject, would be most challenging. Any impression of any differences in size would be hard to confirm.
So allow me to add a statistical look at the pre- and post- COVID-19 findings in this single individual:
A reminder: in this article, cell size is being presented. Changes in form (morphology) are found elsewhere.
So if one still prefers measuring size of neutrophils as the largest diameter on a sphere:
- PRE-Infection size: 16.064±1.468 microns (n=32)
- POST-Infection size: 13.554±1.767 microns (n=37)
- significant difference in size (2.51 microns smaller on average) ?
- Student's two-tailed t-test: t = 6.3575; df = 67; p<0.0001
- In words: after an acute SARS-CoV-2 illness, neutrophils are significantly reduced in size
- but by this method, still "normal in size (=13.5±0.75 microns)" Z-score = 0,072
Using our two-dimensions method:
- PRE-Infection size: 174.410±23.069 µm² (n = 32)
- POST-Infection size: 129.877±23.567 µm² (n = 37)
- that's a 25.53% reduction in neutrophil mean size in this individual
- significant difference in size (44.53 square microns smaller on average) ?
- Student's two-tailed t-test: t = 7.9044; df = 67; p<<0.00001
- In words: after an acute SARS-CoV-2 illness, neutrophils are significantly reduced in size
- using this preferred (two-dimensions) method for neutrophil area, comparing with a normal value of (155.917±24.231 µm²), Z-score = -1.07466
- which simply means that this method discovers a reduction in size of about 1 standard deviation below the mean. The method above (single diameter), identified no such difference.
- using this preferred (two-dimensions) method for neutrophil area, comparing with a normal value of (155.917±24.231 µm²), Z-score = -1.07466
- Some will conclude that this point is just being fussy.
- As we'll see below, those with "long-term" COVID-19 sampled here, present with a marked reduction in neutrophil size.
- So perhaps here, a "transition period" or initial effect is being observed.
- This subject never developed (as of 07-07-2024) any symptoms to suggest a prolonged illness after her viral infection on 17-01-24.
- Eventually, a follow-up estimation of neutrophil size in this individual, will be performed to see what information that may add.
In this Acute COVID-19 subject compared with "Long-term" COVID-19
- Acute POST-Infection size: 129.877±23.567 µm² (n = 37), as given above
- as just shown, a significant reduction in size from her "normal" pre-infection value.
- Those presenting with more chronic illness: 88.198±28.758 µm² (n = 103)
- even without any statistical aide, clearly a difference.
- Diff. = 41.679 µm² or 32.09% smaller in the chronic illness group.
- A further reduction in neutrophil size in moving from acute to chronic illness. (t = 6,5219; df = 65; p = 0,0001 by Student's two-tailed t-test) is strongly suggested.
In those with "Long-term" COVID-19 (LTC)
- In subjects with LTC, brief moderate exercise (6'WT) is followed by a significant 26.3% INCREASE in size of circulating neutrophils. (before any PBM): A result opposite that of controls. Diff. in area: 23.2 µm². Student's t-test, two-tailed: t = -5,0335; df = 207; p = 0,0001. (A negative t-test value just indicates that one group's value obtained was smaller than the other. Many statisticians will always report 't' as a positive value).
- In subjects with LTC, brief moderate exercise (6'WT) after 10 days of PBM to head or head & back, is followed by a 14.1% increase in size of circulating neutrophils. A result again opposite that of controls. Diff. in area: 18.9 µm² Student's t-test, two-tailed: t = -4,0123; df = 219; p = 0,0001.
- Comparing the two results above: 26.3% - 14.1% = 12.2%. Meaning ? Whatever is causally associated with this finding, that is still different and opposite to that in controls, PBM in LTC is associated with a 12.2% "rapprochement" or reconciliation or normalization of that difference in size. Is that a statistically significant finding?
- By Chi² = chi-sq. = 9,79049; p = 0,0018. So while 12% may not seem to be a large difference, the 422 neutrophils observed generated a result that says that this is nevertheless a significant movement towards "normalization." A very significant difference in Exercise findings after 10 days of PBM: based on Neutrophil Morphology in LTC (p = 0,0018). This in support of the idea of a movement towards normalization linked to PBM in the LTC study subjects' cells.
- Just a thought: If in observing neutrophil shape one takes "speroidal' cells as cells 'in waiting', and "ovoid & ellipsoid" cells as those 'ready for action' in response to a "call" from the tissues, why can't these more active forms get out of the capillary to respond to the metabolic and immune "calls" ?
- Pericytes are specialized cells that wrap around and ensheath microvessels, promoting endothelial cell junction stability and depositing extracellular matrix (ECM), among many other key functions. In LTC, have they been damaged so that "active" neutrophils can no longer leave capillaries to get out into the tissues, thereby increasing in number in the circulation? Are the protective "tight junctions" now too tight ? Just a thought, not to say a hypothesis.
- The topic of cell membrane morphology (shape) in these studied neutrophils, in distinction from size, is introduced here, and results of measurements are covered in a different article, found at the link. Too much to include here.
- Comparing the two results above: 26.3% - 14.1% = 12.2%. Meaning ? Whatever is causally associated with this finding, that is still different and opposite to that in controls, PBM in LTC is associated with a 12.2% "rapprochement" or reconciliation or normalization of that difference in size. Is that a statistically significant finding?
- Comparison of LTC subjects with Normal Contols. No exercise in either group. No PBM in either group. (Referred to as 'Day 0'). Circulating control group neutrophils on Day 0 are 43.4% larger than circulating neutrophils from LTC subjects. A Mean Difference in cell surface area of 67.72 µm². This difference, before any PBM and independent of exercise. (A huge difference). Student's t-test, two-tailed: t = 15,3375; df = 161; p<< 0,0001).
- Compared with Negative Controls before exercise or PBM, LTC subjects' circulating neutrophils AFTER exercise have increased in size but remain significantly (14.92%) smaller than Pre-exercise controls. Student's t-test, two-tailed: t = 5,101; df = 148; p = 0,0001.
- Another go at this: Contrary to Controls, where exercise reduced circulating neutrophil size, in LTC subjects, size of circulating neutrophils increased significantly: 10.4% above post-exercise mean size of neutrophils in Controls. Student's t-test, two-tailed: t = -2,6869; df = 148; p = 0,008.
- In LTC subjects, exercise before and after the 10 days of PBM, was still assiociated with a 36.8% increase in circulating neutrophil size (LTC: PBM + 6'WT). Student's t-test, two-tailed: t = -7,4812; df = 220; p = 0,0001.
More results to follow for the LTC Group. And especially, morphology changes related to levels of neutrophil "activity" or "resting state" to use those terms here.
That article on morphology (shape) changes in LTC and Control neutrophils, is found at this link.
In the meantime, here is a link to another page on this site, and presenting articles about the heterogeneity of neutrophil form and function. They do more than just gobble up bacteria.
But if something interferes with their ability to move from capillary to tissue by diapedesis, and on demand, that will spell trouble. See the above link, repeated here, for results and a full discussion.
Exposure size: Head Only (10 min/d) or Head & Back (20 min/d)
In early 2020, well after the pandemic had begun, a questionnaire was formulated to obtain more information. The goal was to characterize what the "long-term" COVID-19 illness was like for those unfortunate enough to have it. As a separate entity, and as most recall, LTC was just emerging at that time. Estimates varied as to its prevalence, and much information has appeared since those earlier days of the (still ongoing) pandemic.
The work at that time, and the results of that first survey can be found at LTCOVID.com which was created and used to organize that initial effort. To help direct one's review of the observations presented on that site, here is a link to an Index of the Questions and their Answers, organized by question number (there were 60).
I start this section on "targets" for intervention using PBM, with a return to the past, for the following reason: to share what was learned that guided further study.
- As most now know, the initial response of the Medical System to those with LTC was much less than satisfactory. One such example, and covered in the survey mentioned above, was that anyone presenting with list in hand to more efficiently recall 16 physical symptoms, and 7 emotional symptoms must simply have an anxiety disorder which should be treated as such. Written reactions to such 'compassionate care' received at that time, can be found at Q.59 of the survey. Such 'care' and reactions to it, are still all too often (sadly) in evidence today.
- This also frequently contributed to heatedly presented responses to this bad care, and that argued strongly that this is a real physical illness, with physical manifestations and findings, and "can we please just drop the psychologic approach, and anxiety medication ?!"
- Nevertheless, the truth about a physical illness having an emotional component as observed in that survey (Q42, 43, 44) was neither surprising (a patient with appendicitis experiences one or more emotional components of that illness), nor has it just 'gone away' since those early days.
Those specific responses to the questionnaire helped define an approach to "targets" for the PBM intervention.
- Accepting (without surprise) that there were emotional components of this illness, and without forgetting nor minimizing the simultaneous physical findings, meant:
- we should "target" the head. That's where emotional issues are felt to live.
- that, without ignoring the relationship with the rest of the body, but
- that's where "emotions" are placed in our society
- if we were in a different or older society, the "target" might have been the liver or the kidneys, as the logical place for where emotions dwell and manifest from.
- the discovery that our devices for PBM emit a light that can penetrate into the head was supportive information.
- in a spirit of devotion to scientific method, the thought also occured that as long as you shine the light on the skin somewhere, that may be all you need, to address overall findings in those with LTC. The head has skin (usually), but let's add a little more skin surface to see what that does: was the thought at the time.
- so appeared as a "target": the back. Or the two: Head & Back.
- we should "target" the head. That's where emotional issues are felt to live.
Would shining the light on skin, no matter where on the body, still get a positive response, and including for that sticky issue (more or less accepted) of "emotional issues" ?
All of that needed to be embarked upon, not with sort of a "Whack-A-Mole" approach, but couched as well as possible, in all of the supportive Science. Here's an example of what's meant by "supportibe Science":
Estimation of the spectral absorption of light by components of human skin
Or,
Differences in light wavellengths and body penetration as carefully studied in that article.
Or,
Skull and vertebral bone marrow are myeloid cell reservoirs for the meninges and CNS parenchyma
The above reference gives new support for "targetting" the skull (head, in common usage).
I mean, one reason to "target" anything in this work, is to help a specific area that is theoretically involved with its presumed "problem." But what if there are mechanisms that permit neutrophils, for example, to be "targets"?
After all, they pass through the skin's capillaries.
After all, they travel everywhere.
And after all, in their travels they communicate with many other components of our innate immune system.
And of course, other pertinent reports, and as already presented back at LTCovid.com
One page where that was explored is found at this link.
Many other links at LTCovid.com, to published related works, can still be found and have not lost importance or relevance in the recent past years.
It will be mentioned here that if "Head Only" versus "Head and Back" made no difference, we accepted that 10 minutes per day, or 20 minutes per day might make a difference. That has yet to be explored; still a "thing to do" in our several protocols.
Back to the present
The evolution beyond that first work, initially and still today, can be found at several locations on this present site of StudyLTCovid.com, and for example: Interventions
The process described there, while still valid, has also evolved.
So we did all of that, and here are some of the results that emerged, and pertaining to neutrophil cell size and body part(s) exposed ...
In LTC subjects, exposing Head Only (so, 10 minutes/ day)
Results independant of any exercise were that Mean Neutrophil Size increased from 111.73±25.2 µm², n=43 (Day 0, Pre-PBM) to 138.73±31.2 µm², n = 45 (Day 11, Post-PBM). That difference, an increase of 27 µm², was statistically significant by two-tailed Student's t-test (t = -4.4547; df = 86; p=0.0001).
If the desired effect is to see an increase in neutrophil size in response to PBM in the setting of LTC, exposing Head Only is adequate.
In LTC subjects, exposing Head & Back (so, 20 minutes/ day)
Results here, are again independant of any exercise. Mean Neutrophil Size increased from 71.34±16.9 µm², n=60 (Day 0, Pre-PBM) to 129.69±26.4 µm², n = 60 (Day 11, Post-PBM). That difference, an increase of 58.35 µm², or 81.8%, was statistically highly significant by two-tailed Student's t-test (t = -14.4513; df = 118; p<<0.0001).
Exposing Head & Back and for twice the duration of the Head Only subjects, did increase neutrophil size.
In LTC subjects, which "target" size and duration was better?
Comparing the above results, and summarized as a Day 11, Post-PBM value for Mean Neutrophil Size of 138.7µm² in the Head Only/ 10 min group, with that of 129.7µm² in the Head & Back/ 20 min group, that difference was not significant (t = 1.6067; df = 103; p=0.1112).
While some might say that difference is quite close to being significant, the "smaller effort" may still be adequate to the goal when one is focused on increasing neutrophil size.
A reminder: Neutrophil size is taken as reflecting a cell's energy stores and response to metabolic needs, in varying states of health or illness.
An additional comparison that may be informative, even if presented above ...
In NC (normal, or Non-COVID Control) subjects, exposing Head Only (so, 10 minutes/ day) x 10 days
Results still independant of any exercise, Mean Neutrophil Size was 155.92±24.2 µm², n=60 (Day 0, Pre-PBM), and 154.03±21.7 µm², n = 60 (Day 11, Post-PBM). That difference, (essentially, no difference), was not surprisingly statistically insignificant by two-tailed Student's t-test (t = 0.4505; df = 118; p=0.6532).
Or perhaps simply put: What was normal, stays normal.
Other variations on the theme ... exercise effects, without any PBM
In LTC subjects, before any PBM, so independent of eventual "target" area and exposure duration (Day 0 at rest, then 6 minute walking test)
Results now reflecting only exercise effect: Mean Neutrophil Size pre 6'WT 88.198±20.76 µm², n=103 (Day 0, at Rest, No PBM) to 111.396±37.2 µm², n = 106 (Day 0, Post-6'WT, No PBM). That difference, an increase of 23.2 µm², or 26.3%, was statistically highly significant by two-tailed Student's t-test (t = -5.0335; df = 207; p<0.0001).
An aside: This result is quite different from that in Normal Controls, where the same exercise reduces neutrophil cell size in circulating cells.
Another aside: There are also some differences in distribution of "active" versus "resting" neutrophil cell membrane morphology or shapes in these same cell samples. Not to add to the confusion here, that topic of "shapes" and "activity" level, is better left for this separate article.
But the result is important and available. And yes, LTC and NC results are different.
But what happens to that "exercise effect" after PBM ?
In LTC subjects, AFTER any PBM, Head Only & Head and Back combined (Day 11 at rest, then 6 minute walking test)
Results now reflecting PBM and any exercise effects: Mean Neutrophil Size pre 6'WT
133.57±28.9 µm², n = 105 (Day 11, Pre-6'WT, Post-PBM) and 152.42±43.84 µm², n=116 (Day 11, Post-6'WT, Post-PBM). That difference, an increase of 18.9 µm², or 14.1%, was statistically highly significant by two-tailed Student's t-test (t = -4.0123; df = 219; p<0.0001).
Here the results from above are starting to be duplicated. But just to keep things togther for easier reading, what about the comparison with Normal Controls ?
In NC (normal, or Non-COVID Control) subjects, exposing Head Only (so, 10 minutes/ day) x 10 days - before and after exercise
Results now reflecting PBM, and possibly, any exercise effects: Mean Neutrophil Size pre 6'WT
154.02±21.74 µm², n = 60 (A normal value for size, Day 11, Pre-6'WT, Post-PBM) and 119.18±29.9 µm², n=60 (Day 11, Post-6'WT, Post-PBM). That difference, a reduction in mean neutrophil size of 34.84µm², or -22.62%, was statistically highly significant by two-tailed Student's t-test (t = -7.2998; df = 118; p<0.0001). And as seen before 10 days of PBM in Controls in response to exercise, a reduction in circulating neutraphil mean size here, once again. And, opposite the findings above in LTC subjects.
-----
Without wanting to overstate the importance of the results just presented, it is especially pertinent to underscore the importance of neutrophils in the innate immune system, and not understate that.
Neutrophils are doing much, much more than just gobbling up some bacteria in your gums each time you brush your teeth.
So what is at times summarized as the "heterogeneous structural and functional" findings of neutrophils, should allow us to expect a much greater role in creating those differences found here between LTC and NC subjects: And as important, their response to modifications in their cellular energy levels implied by their physical changes from an intervention with PBM.
PBM in these Normal Controls did not change neutrophil size.
Exercise in Normal Controls, before or after 10 days of PBM, reduced the size of circulating neutrophils as measured on peripheral blood smears.
Did the demands in the tissues (mostly muscle one assumes) of even brief (6 minutes) moderate exercise, move larger and more active neutrophils out of the capillary, and into the tissues, as a "normal" response ?
The response to PBM ± exercise in LTC subject neutrophils was clearly different.
And the "demands in the tissues" certainly extends beyond just muscle, as exercise physiologists have often confirmed. (Hormonal, nerve, brain, metabolic changes, etc).
Terms like "Post-Exertional Malaise," "Brain Fog" and others, readily come to mind.
Here we've made many "Before and After" observations about fairly objective data. (It's hard to subjectively control the size and shapes of one's neutrophils).
But the result of "just feeling better" should not be minimized.
That too will be objectively presented elsewhere, very soon.
---------
"OK. I understand. Who's got the light?"
>>> Introduction to Neutrophil cell membrane shape changes
>>> Our neutrophil shape change results in NC and LTC subjects
Can neutrophil-related damage be moderated by other than PBM?
Here's one example that is pertinent:
>>> Lots of info about Colchicine
And another:
>>> Neutrophils and Multiple Sclerosis
A découvrir aussi
- Neutrophil Cell Membrane SHAPE Observations
- Neutrophils and Colchicine
- Neutrophils and Multiple Sclerosis